

The decision: which customers to put the next offer in front of, and which to leave alone.
A conversion rate for the whole base is not a decision. Blanket campaigns train customers to ignore you, and they spend budget on the majority who were never going to take the offer.
Questions It Answers
- Which customers are ready for an add-on, and which for a higher tier?
- What in their behaviour gives it away, and how far in advance?
- Which part of the base is worth an offer, and which is worth leaving alone?
- Which segments are being over-contacted for no return?
- Where should a fixed promotional budget be pointed this quarter?
What We Analyse
Churn tells you who is leaving. This tells you who is ready to spend more, and neither answer is derivable from the other.
The ordering, not the rate The output is an ordering, not a percentage: which fifth of your customers is worth an offer, and which fifth is worth leaving alone.
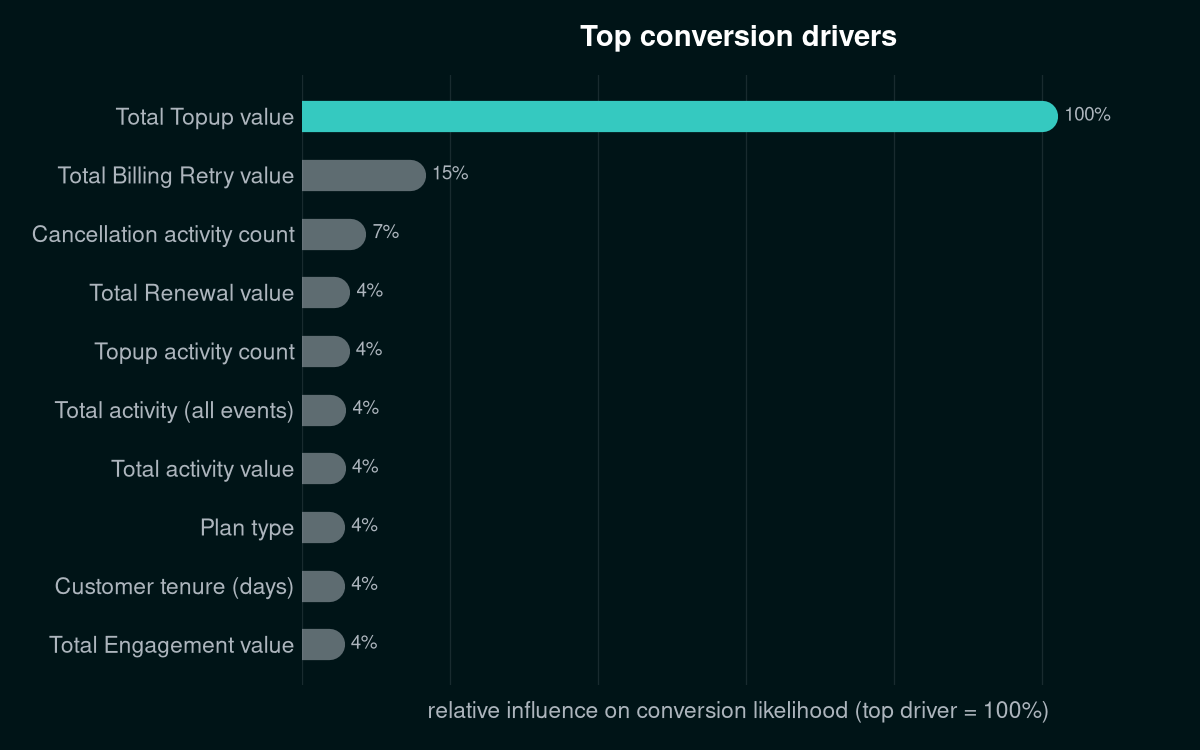
Behaviour ahead of the purchase Subscribers repeatedly topping up are subscribers bumping against the limits of the plan they are on, and that shows up in billing data well before any conversation happens.
Attribution to a named signal Each ranking is attributed back to the behaviour behind it, which is what lets the offer be chosen rather than guessed at. A customer pressing against a data ceiling and a customer whose usage has changed shape need different offers.
Where the opportunity concentrates Break the ranking down by segment, so the campaign lands where it converts. In the sample telco run the top band converted at roughly three times the base rate while the bottom two bands sat near zero.
Testing it holds Check the result against customers and periods deliberately kept out of the work, so a finding that only holds where it was built never reaches you.
What Your Data Has To Carry
Current holdings
What each customer is on today: plan, tier, add-ons, and when each of those started. This is the line the recommendation has to be on the far side of.
Billing and topup history
What each customer has paid, how often, and in what pattern. Frequency and shape matter more here than totals.
Usage and event history
Whatever you log about what customers do. The signal in these datasets is behavioural rather than demographic, so this is the part that carries the answer.
None of it requires new data collection. It is already in the billing and event history you keep for other reasons.
What You Get
Ranked, not scored
Your base ordered by readiness, so the commercial team chooses where the line falls rather than inheriting a threshold from a model.
The reason named
The behaviour behind each ranking, so the offer can be chosen rather than guessed at.
Bands, not a rate
Which fifth of the base is worth the next campaign, and which fifth to leave alone.
Where it lands
Segment breakdown showing where offers convert and where budget is being spent for nothing.
What Is Inside The Report
- Executive summary of who converts and how concentrated the opportunity is
- The top signals preceding a purchase, ranked and explained in plain language
- Propensity bands: which fifth of the base is worth the next campaign
- Concrete, prioritised recommendations, including who to stop targeting
- Full methodology section for anyone who wants to check the work
Why the ranking matters more than the rate. A campaign aimed at the top band reaches roughly three buyers for every one a blanket campaign finds, and stops spending offers on customers who were never going to take them. That is what a fixed promotional budget turns on.
Before You Enter Your Email
The data is synthetic, on purpose
No customer of ours appears in these reports. Each dataset is generated to reproduce the messiness of a real book of business: probabilistic behaviour, uneven engagement, decoy customers who look ready to buy and never do. It is not toy data tuned to make the model look good.
No revenue figure, on purpose
The report does not claim a euro value for the upside, because that depends on your pricing and margins rather than on anything in the data. What it does establish is how concentrated the opportunity is, which is the part a model can actually settle.
Your email is not a mailing list
We send the report, and one follow-up asking whether you want this run on your own data. That is it. No newsletter, no sharing with anyone, and replying "no thanks" ends it.
Get the sample cross-sell diagnostic
Pick whichever industry is closer to your own, enter your email, and the matching diagnostic PDF is on its way in about a minute. No account, no data upload.
On Your Own Data
The Revenue Diagnostic runs this work on your own base, alongside the acquisition return and churn picture, on one set of numbers. Cross-sell is checked the same way churn is: the ranking is tested against customers and periods held out of the work, so a readiness signal that only holds where it was built never reaches your campaign team.
